Every product team wants to know what makes their product thrive. They want to know how to optimize metrics and leave users the happiest and most engaged. Without a way to definitively understand user behavior, they must turn to anything they can. Enter the A/B test.
Ultimately, every A/B test starts from a hypothesis. The hypothesis could be, “If we did [blank], then we would improve conversion.” Or “Feature X should drive increased retention, let’s test out that assumption through an A/B test.”
The goal is almost always to drive a key performance indicator (KPI) such as conversion, retention, engagement, etc. These are lag measures, meaning that they result from a change in a lead measure that the product team can control.
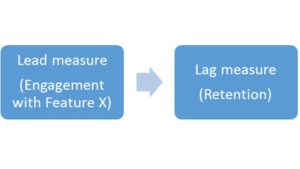
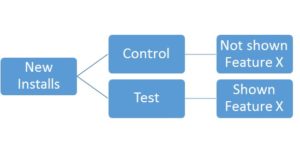
If the product team thinks that engaging with Feature X boosts retention, they can set up a test where half of new users see Feature X and half do not.
However, it is important to note there is a business risk to adding a feature that could hurt existing KPIs. Therefore, teams often introduce a new feature to one percent of users and ensure that it did not do any harm. From there, the team “ramps up” the percent of users seeing the new feature.
When starting a test, it’s good practice to know how long it will take to reach statistical significance based on the size of each test group. There are various tools that make this fairly simple to estimate, such as this one. For this example, let’s assume it’ll take 14 days of data to reach significance.
Once those 14 days have passed, it’s time to look at the readout of the test.
![]()
Using this readout, we can do a z-test to see if there a statistically significant difference between the control and test groups. We do a two-sided test: this means that we assume the two groups are equal unless that is proven to be very unlikely by our data, at which point we assume there is a difference. We can plug our data into a significance calculator, and we find statistical significance.
We have reason to believe that Feature X did in fact boost retention for new users. In this case, we should roll out this feature for all users.
But what if this was not the case? What if it did not drive a retention increase? In that case, it may be because the retention rates are too close to call, and the test may need more time to gather data.
It’s entirely possible that there never will a significant outcome from test, and that’s okay. Then it’s time to go back to the drawing board. The product team will have to conduct a post-mortem on why this feature did not achieve its goals.
Then comes another hunch, another hypothesis, and the process comes to life again.