This month I set out to complete a separate ad-hoc analysis each week. For this week, I decided to analyze the effectiveness of FiveThirtyEight’s 2018 House elections predictions.
However, due to data quality issues, the results are not accurate. Therefore, I will not dwell on the exact numbers but the framework through which I approached the analysis.
First, I loaded in the predictions data. Then I loaded in outcomes data from another source, and joined the two data sets together.
FiveThirtyEight has three prediction types – classic, lite, and deluxe. I chose to focus on deluxe, which takes in various factors and would seem to be the most accurate. And since each race has multiple parties, I chose to measure the predictions from the Democratic point of view.
To analyze the effectiveness of the predictions, I looked at them in two ways:
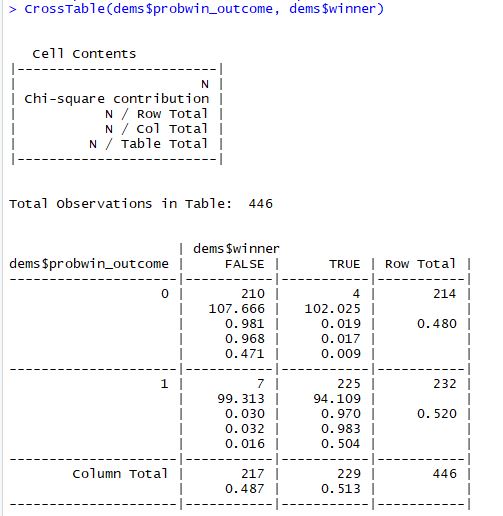
- Accuracy. If a candidate has >=50% chance of winning, I assigned the candidate as the “expected winner.” What percent of expected winners ended up winning? What percent of expected losers ended up losing? Basically, this is classifying the outcome correctly.

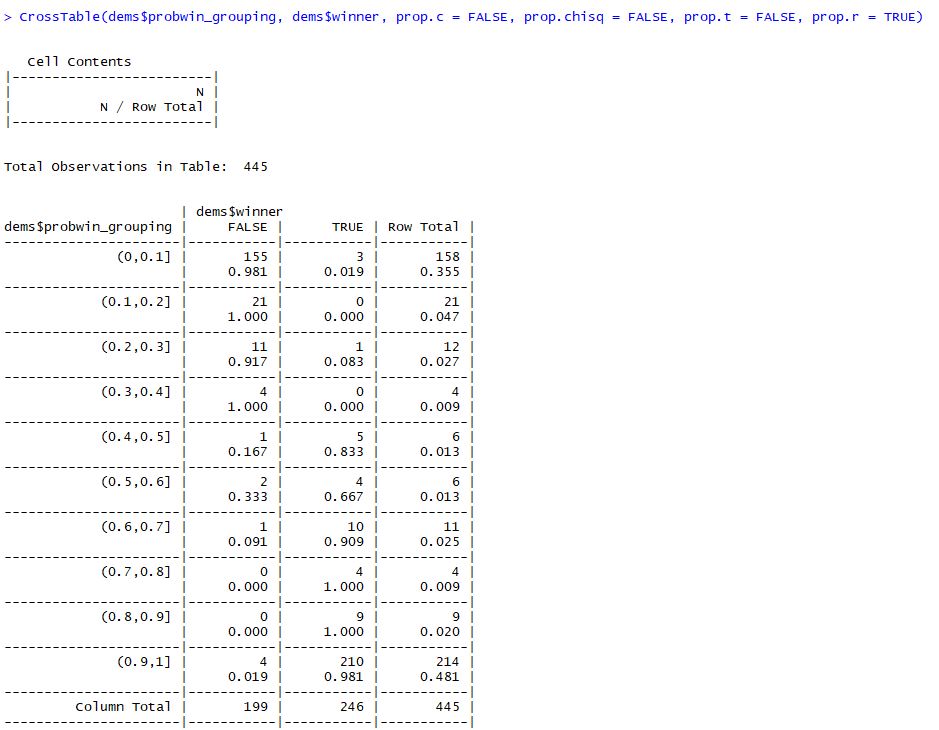
- The value of the win probability. If 10 candidates have a 90% chance of winning, 9 of them should win. I grouped the candidates into percentage buckets to see how accurate they were.
dems$probwin_grouping = cut(dems$probwin, breaks=seq(from=0,to=10,by=1)/10)
CrossTable(dems$probwin_grouping, dems$winner, prop.c = FALSE, prop.chisq = FALSE, prop.t = FALSE, prop.r = TRUE)

I hope to continue this analysis and resolve the data quality issues.
That’s all for this week.