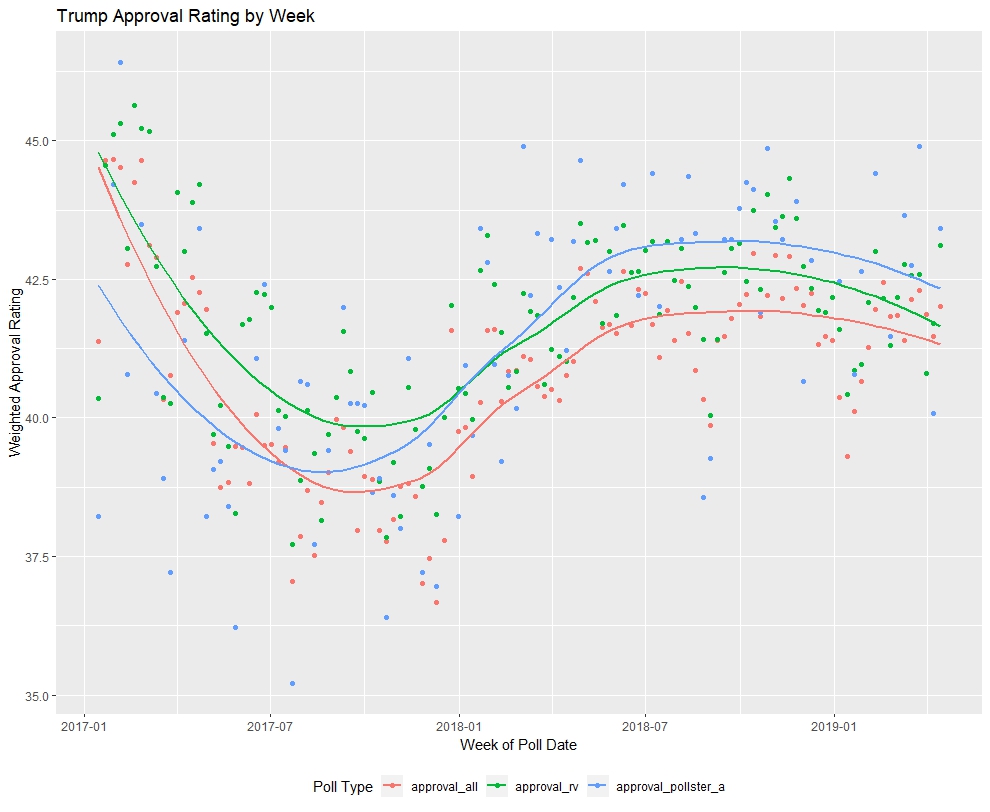
This month, I set out to complete a separate ad-hoc analysis each week. This week, I chose to dive into President Trump’s approval rating, with inspiration from FiveThirtyEight.
First, I grouped the polls by week, to reduce noise in the averages and make for easier plotting. Then I got the weekly average across three dimensions: all adults, registered voters, and solely A-graded pollsters (using registered voters). Here’s a cool use of the “lubridate” package to generate the weeks and the “reshape2” package to prep the data for graphing:
polls$poll_week = floor_date(as.Date(polls$startdate, “%m/%d/%Y”), unit=”week”)
plot_data = melt(polls_avg, id.vars = “poll_week”, variable.name = “poll_type”)
Here’s the weekly chart:

Some analysis:
- Registered voters have always been kinder to Trump than the all adult population.
- The “Grade A” pollster average seems to have more noise due to lower sample. It was trending below the overall average, but it is now above average.
- Trump’s approval sagged over 2017, but it reversed at the end of the year and has been higher in 2018/2019. This is likely due to the growing economy.
Then, I looked at Trump’s biggest rises and drops in approval rating.

Trump’s biggest jump, in relative terms, was in December 2017 right after the passage of the Tax Cuts and Jobs Act of 2017. Trump’s biggest drop was in July 2017 right after his disastrous press conference with Vladimir Putin, in which he questioned the US intelligence community.
That’s all for this week.