I have written about R in the past, and it is one of the hottest tools for data analysis today. To further demonstrate the power of R, I found click-through rate data on Kaggle. The dataset is over 6 gigabytes and has over 12 million rows, but I limited the dataset to 2 million rows for the sake of performance in R.
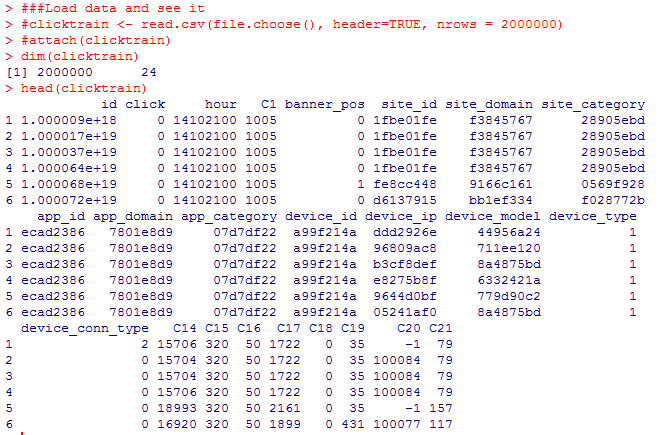
First, I loaded the dataset and took a look at the first few rows to get a sense of the data. There are 24 columns: an ad id number, whether the user clicked on the ad, and various categorical variables describing where and how the ad was seen.
My area of interest was the “click” column, a binary variable where a value of 1 means that the user clicked and 0 means the user did not click. After analyzing the data, I found an overall click-through rate of 16.16 percent.
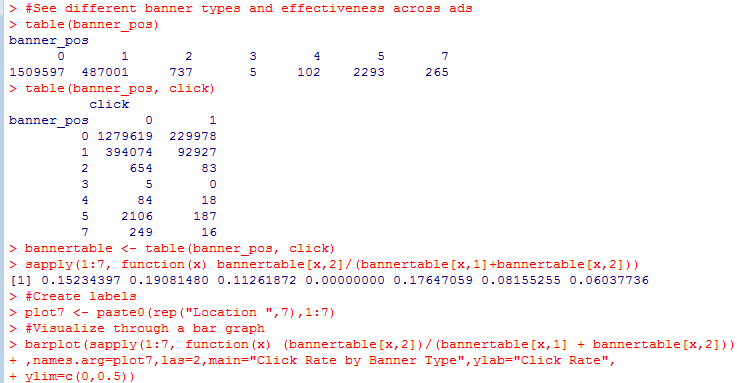
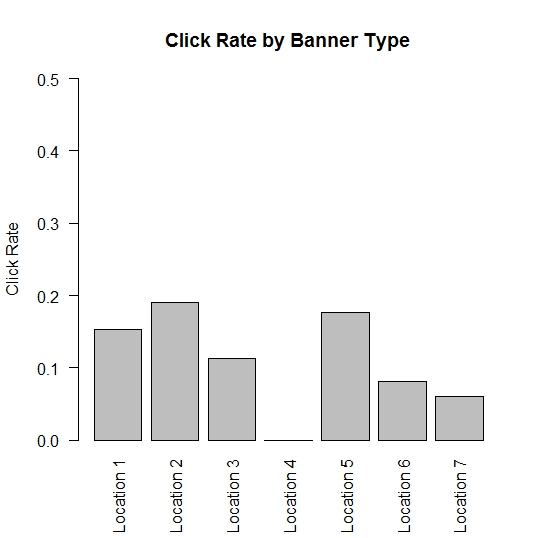
After seeing the overall click-through rate, I wanted to see it by the position of the ad, indicated by the categorical variable banner_pos. First, I got the count of each banner location (using the table function) and then looked at click-through rate by looping through the table (using the sapply function). Position 0 had a 15.2 percent click-through rate, as compared to 6 percent click-through rate for position 7. I also created a bar graph to visualize this data.
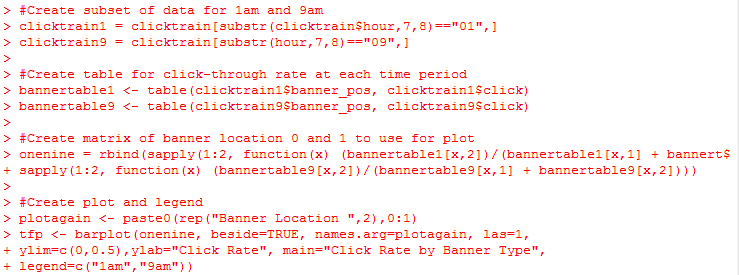
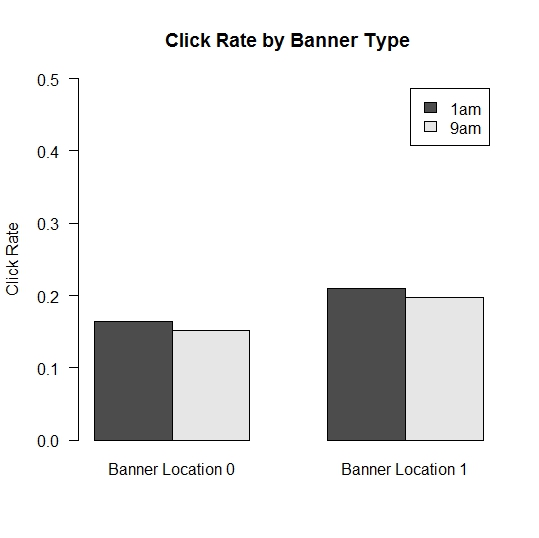
Next, I wanted to compare two banner locations at two different times of the day. So I created two subsets of data, one for 1am and another for 9am. I used that to create a bar graph; it shows that both banner locations have higher click-through rates at 1am than 9am.
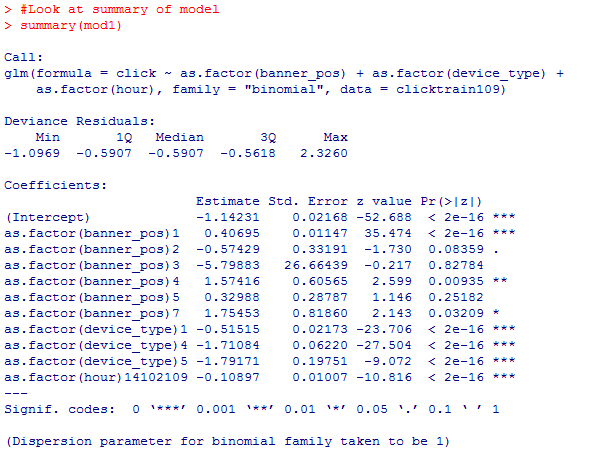
Finally, to test what variables have an effect on click-through rate, I decided to use a logistic regression. I created a new dataset of all clicks in the 1am and 9am time periods. I then created a model with inputs banner location (as a factor variable), device type (as a factor variable), and hour of day (1am or 9am, as a factor).
In looking at the regression output, different banner locations are statistically significant as compared to the base group, even controlling for time of day and device type. Device type and time of day are also statistically significant when controlling for other factors.
Hope this post was informative, enjoy.


One thought on “Data Analysis in R”
Comments are closed.