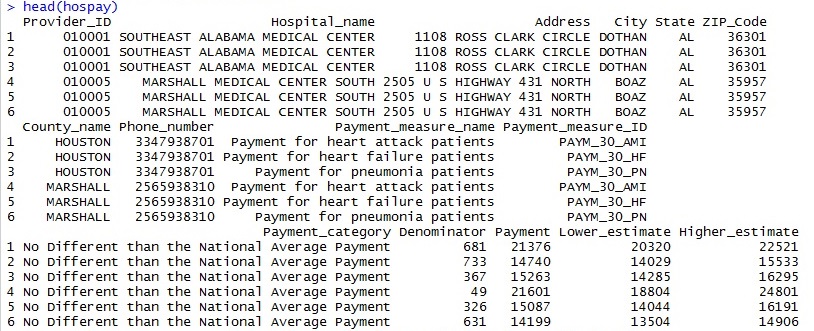
Building off my last post, I want to use the same healthcare data to demonstrate the use of R packages. Packages in R are stored in libraries and often are pre-installed, but reaching the next level of skill requires being able to know when to use new packages and what they contain. With that let’s get to our example.
Useful function: gsub
When working with vectors and strings, especially in cleaning up data, gsub makes cleaning data much simpler. In my healthcare data, I wanted to convert dollar values to integers (ie. $21,000 to 21000), and I used gsub as seen below.
Package: reshape2
In looking at the data, I wanted to focus on the Payment estimate. So I used the melt() function that is part of reshape2. Melt allows pivot-table style capabilities to restructure data without losing values.
Package: sqldf
With my data melted, I wanted to get the average estimate for heart attack patients by state. This is a classic SQL query, so bringing in sqldf allows for that.
Now that my data is in perfect shape to visualize with a map overlay, ggplot2 and maps are two other R packages that would be useful. In the future, I’ll look to discuss those as well.


One thought on “R Packages: A Healthcare Application”
Comments are closed.