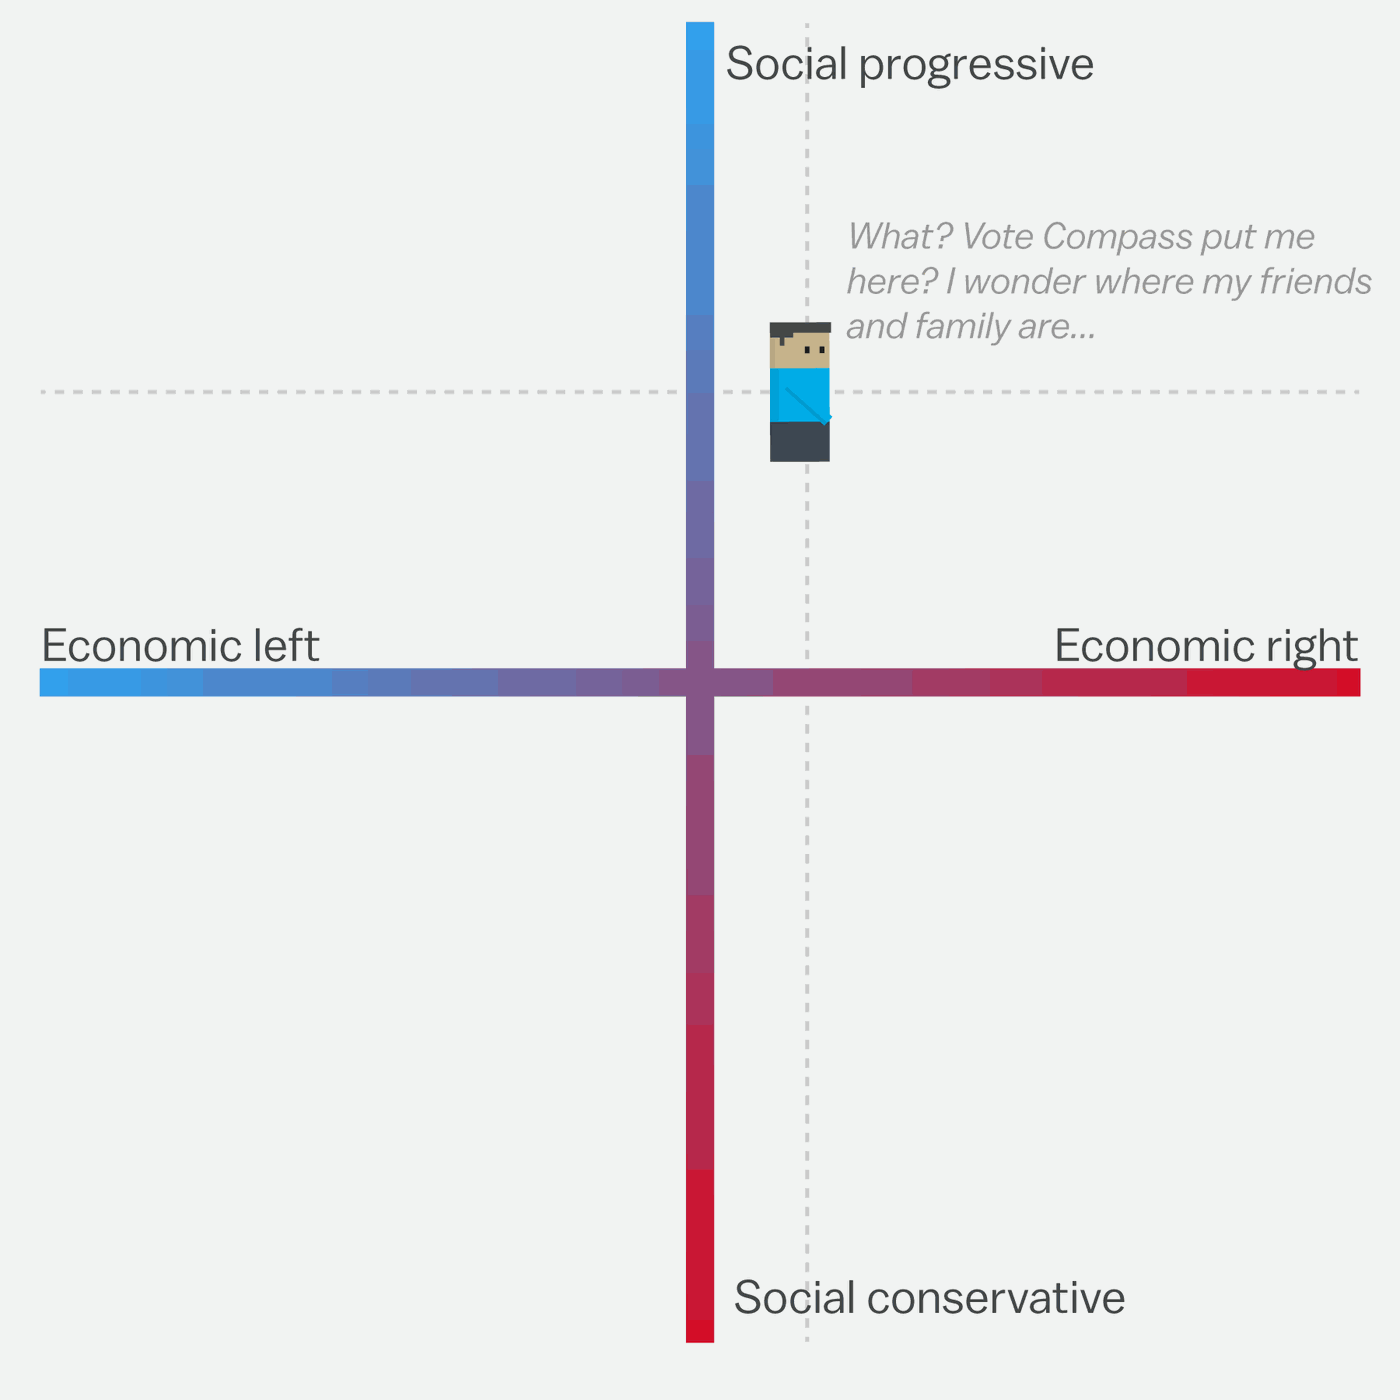
Typically, US politics is thought of in a two dimensional framework, with politicians put on a spectrum on both social and economic issues. However, with the realignment brought on by the Trump Administration, with it’s “America First” and trade-reducing policies, there has been a movement toward a framework that don’t fit traditional Conservatism in the US.
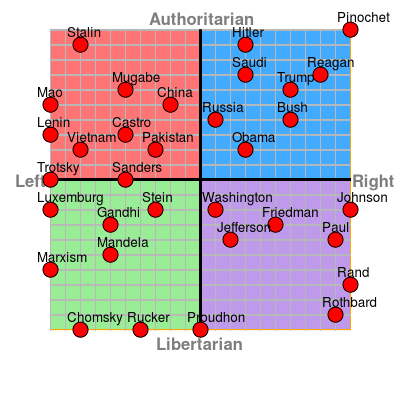
While there have been attempts to write about this framework more broadly, I hoped to dive deeper. I wondered if I could visually graph the positions of all current US Senators in a three dimension political spectrum.
If I wanted to get rid of the two dimensional approach and go with the three dimensions, I had to figure out what the three were. I decided to stick with social issues and economic issues, and for the third dimension I went with “globalism.” This is refers to the desire of the Trump Administration for the US to cut itself off from the world, with reduced involvement in world organizations, stricter immigration laws, and high tariffs.
To quantify the dimensions, I used “voting scorecards” given by civic organizations and think tanks. I went with the following:
- Fiscal issues were represented through the Club for Growth score. Note that I had to invert the score because higher meant more conservative.
- Social issues were represented through the ACLU score.
- Global issues were represented through the NumbersUSA score. NumbersUSA advocates for lower immigration to the US, so I had to invert the score to make it progressive.
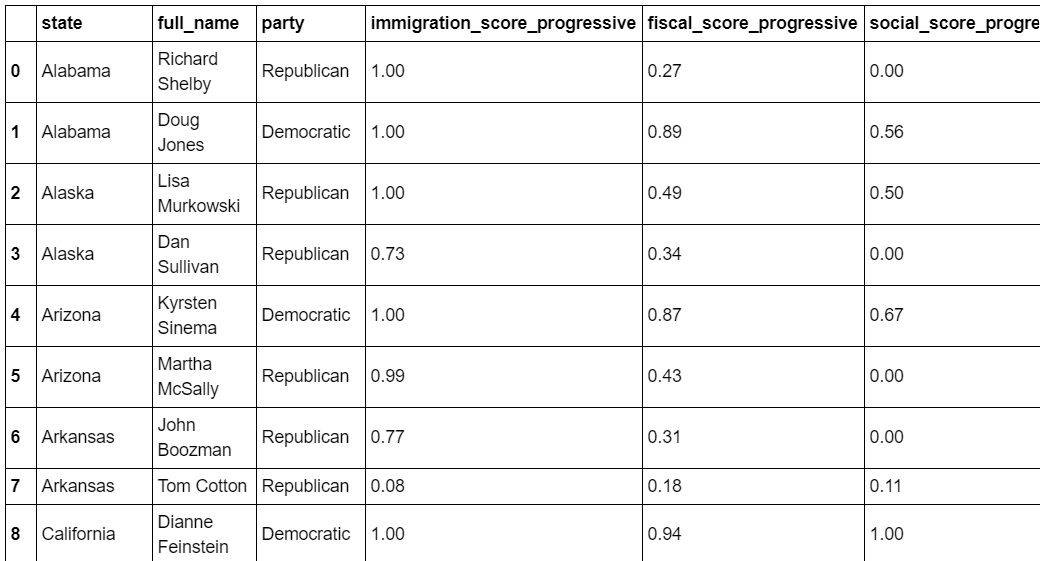
There was no way to automate this, so I gathered the data by hand. This is what the data looked like once ready:
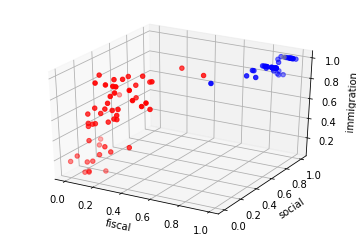
First, I decided to plot my data and see what it looked like, using blue for Democrats and red for Republicans. We can see that the Democrats are clustered fairly close together, while the Republicans have a wide range of positions across social and immigration issues. Yet, the one dimension that unites all Republicans is fiscal issues. [NOTE: All my code to do this analysis can be found here.]
Inspired by this post by Ben Alex Keen, I set out to apply a k-means approach to this. K-Means Clustering is non-parametric machine learning model that puts observations into groups (“clusters”) based on a distance from the observation to the center of its cluster. Since this requires distance measurement, the data must numeric and in this case it is. For my own learning, I decided to follow Ben’s code which manually created the clusters, but the “sklearn” library makes it super easy to implement quickly and is included in the link as well.
After fitting the clusters, here is the output we get:
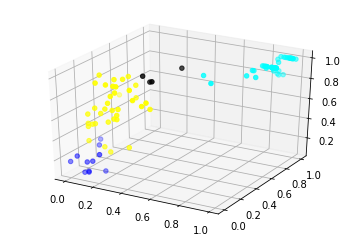
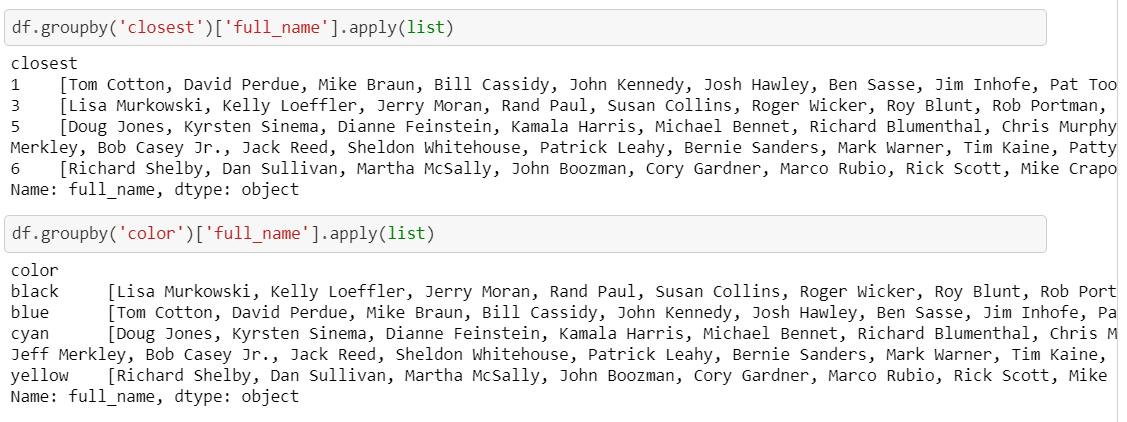
We can see that there are four main clusters (blue, yellow, black, and cyan). The Republicans seem to be split among three clusters, whereas the Democrats all seem to be unified in one cluster. And is in fact what we have.
You can find all the code and documentation on GitHub. Feel free to contact me (info on the About Me page) with any questions.