With the NBA season getting underway in the Orlando bubble, I decided to simulate the rest of the regular season along with the playoffs.
This idea originated when I was looking at elo data on FiveThirtyEight, a data journalism website, along with some simulations done by ESPN (paywall). The elo method is a measure of strength based on game-to-game results, originating in chess but applied to other domains, with a value of 1500 indicating a league-average NBA team. Elo is a zero-sum system, meaning that when one team gains a certain amount of elo from a win, the defeated team must lose the exact same amount of elo. Elo changes are based on the strength of the two teams – a team gains very little elo from a win over a massive underdog compared to beating a similar strength team.
To do this, I used Anaconda, which allows for a Python environment via a Jupyter notebook. Within the Jupyter notebook, I reconstructed the logic of the regular season games, the play-in tournament, and the playoff games. I constantly updated team strength as I went, and I recorded where a team ended up in the regular season standings as well as each successive playoff round reached. All my code and input files can be found in a GitHub repository, and the exact simulation code can be found here.
Before I show the results, let’s go through assumptions that I made, as well as how others can experiment with the code.
- I did not modify team elo values with home court advantage. This is because we do not yet know how this will affect teams in this fan-less setup.
- For each team, I look their game-result based elo value (how the team has played to this point) as well as FiveThirtyEight’s full strength elo (based on player advanced statistics). To obtain each team’s “starting” elo for this restart, I weighted their game result and full strength elo’s (50 percent weight on each). One could change that weighting, or even change elo values all together.
- Once the teams start the regular season, they will have elo changes with game results. For the start of the playoffs, I weighted their regular season starting and ending elo’s (50 percent weight on each). The logic is that we want to regress teams to their true mean, and we don’t want to give too much credit to an 8 game hot streak.
- For the playoffs, I did not update team elo values within a given playoff round, waiting until after they won to give a new value. This was ensure, for example, a team that went up 2-0 did not get such an elo boost that the other team had a slim chance to come back and win.
I left comments in my code for where one can update parameters and see different results. My work relies on various assumptions, and I wanted to leave the door for others to make changes.
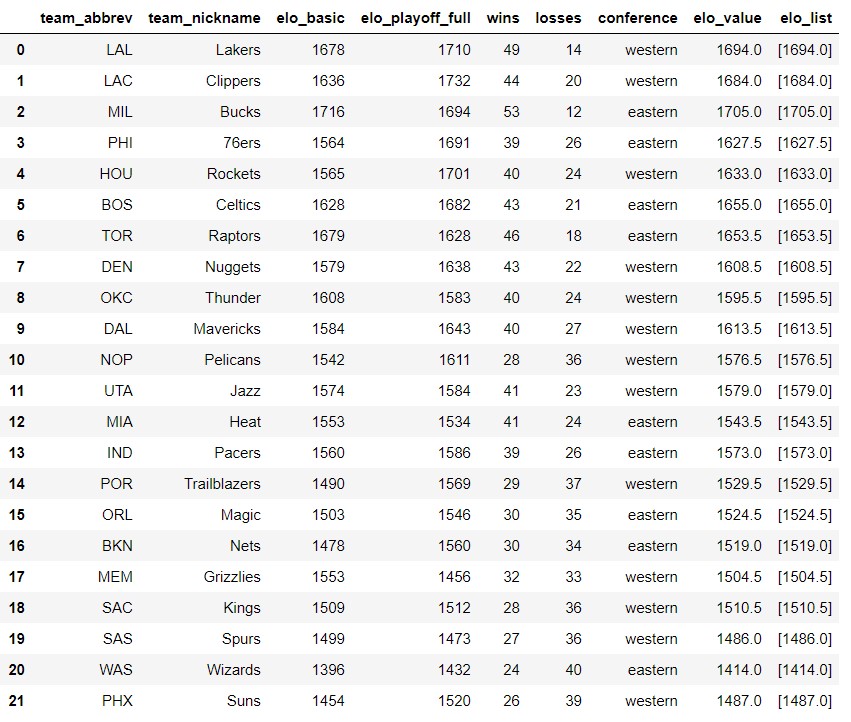
These are the team elo values, taken straight from FiveThirtyEight with some cleaning and weighting done by me.
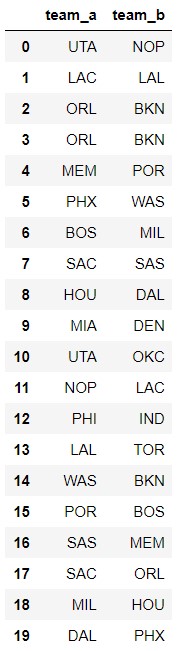
Next, here are the regular season games. It’s taken in exact order from the official schedule to make sure elo fluctuations happens appropriately.
Using these inputs, I simulated the season 500 times. I obtained western conference standings, eastern conference standings, and playoff results. I looked at regular standings by seed and playoff results by round reached. I aggregated the results from the 500 seasons then divided by 500 to get percentages for each outcome (a team getting a certain seed or reaching a certain round).
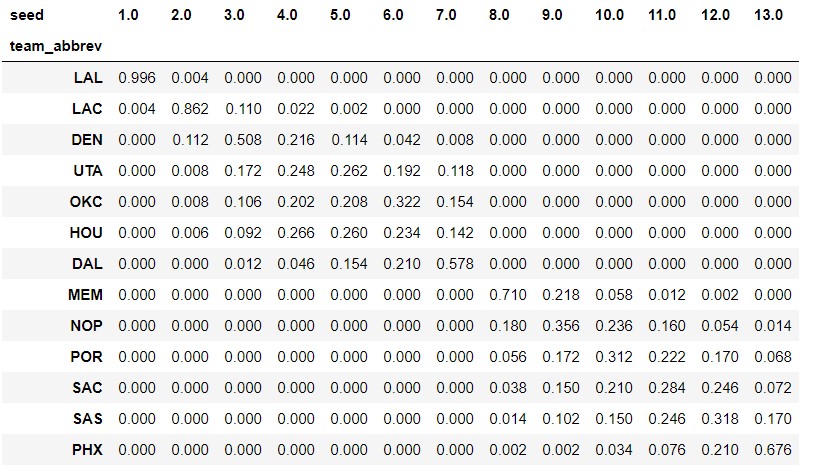
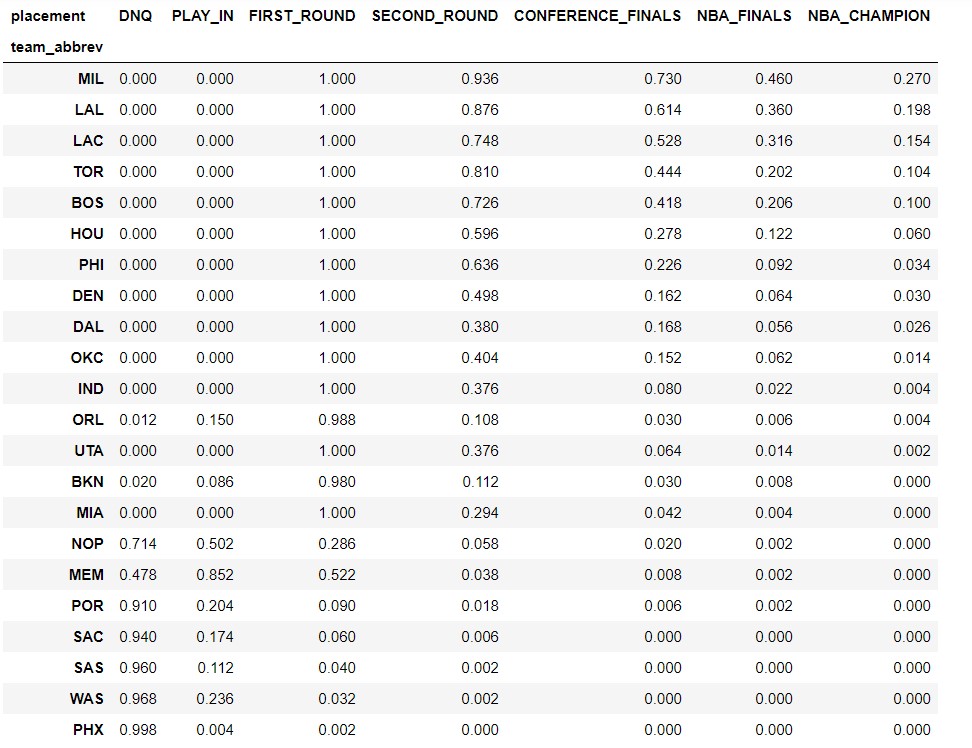
Some insights from these simulations:
- The championships won passes the eye test. Milwaukee, the Lakers, and the Clippers are at the top, followed by frisky Boston and Toronto.
- The Lakers get to the second playoff round nearly 94 percentage of the time, meaning that the models don’t give a lot of credence to the teams competing for the 8th seed in the Western Conference. On the other hand, the Clippers only reach the second round 88 percentage of the time, which is due to the stronger quality of teams, such as a dangerous Dallas team, which could end up as the 7th seed.
- The model likes Houston. They make the Western Conference Finals more often than Denver and Utah, two team they are likely to be seeded behind. This is due to the high “full strength” elo that FiveThirtyEight gives them.
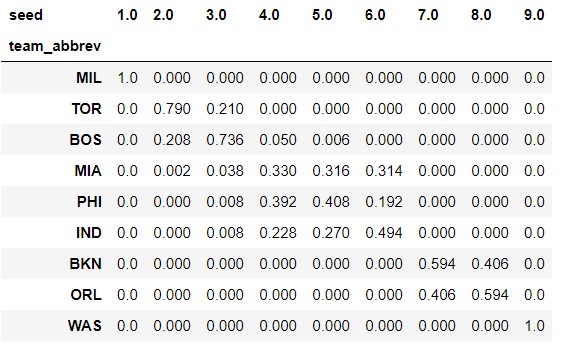
- Although Milwaukee has been an unstoppable force this season, the model sees them making the NBA Finals less than 50 percent of the time. Elo really likes both Toronto and Boston, and each of them make the finals in about 20 percent of simulations.
- Although Miami has played well this season, elo doesn’t like them very much. They don’t win a championship in a single simulation, while non-contender Orlando does.
This season and bubble will be one for the ages. Who knows what to expect? The one thing to be sure of – we’ll all be watching.